Gold Price Analysis: XAU/USD remains depressed below $1,780 level ahead of US GDP
- Gold struggled to capitalize on its early move up, instead witnessed a turnaround from one-week tops
- A fresh leg up in the US bond yields, the risk-on mood both contributed to the intraday selling bias.
- Mixed oscillators warrant caution for aggressive traders ahead of the Advance US Q1 GDP report.
Gold continued losing ground through the mid-European session and dropped to fresh daily lows, around the $1,772 region in the last hour.
The precious metal struggled to capitalize on its early positive move, instead witnessed an intraday turnaround from one-week tops. The underlying bullish tone was seen as a key factor that acted as a headwind for the safe-haven XAU/USD. This, along with a strong pickup in the US Treasury bond yields, prompted some fresh selling around the non-yielding yellow metal.
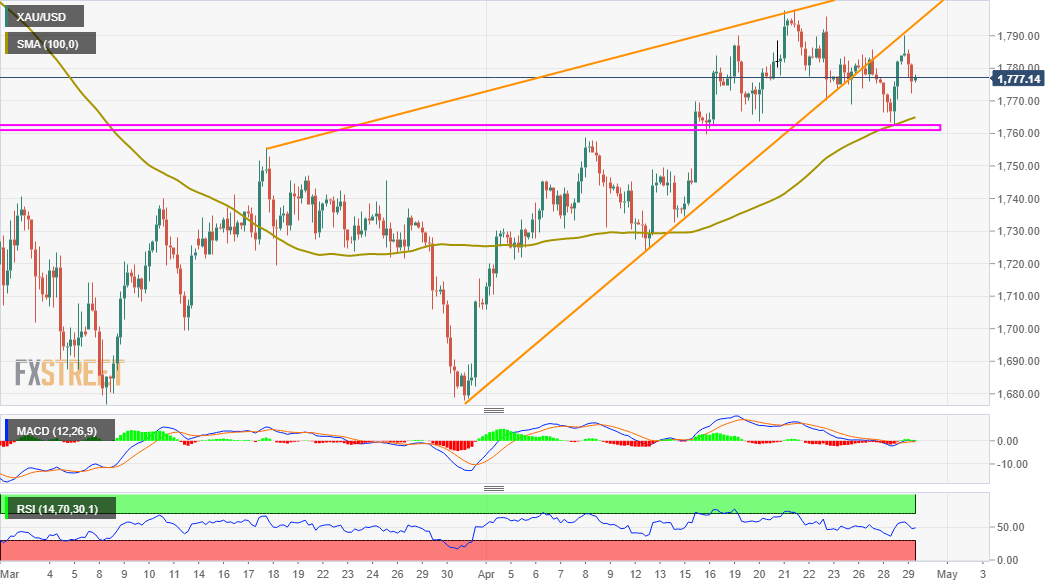
Looking at the technical picture, the overnight goodish rebound from the $1,765-60 strong resistance breakpoint, now turned support, stalled near the $1,790 region. This comes on the back of the recent failures near the $1,800 mark and suggests that the recent strong recovery from multi-month lows, around the $1,677-76 region might have already run out of steam.
The bearish outlook is reinforced by the fact that the XAU/USD on Wednesday confirmed a break below a bearish rising wedge pattern. Moreover, technical indicators on hourly charts have been drifting lower in the bearish territory. That said, oscillators on the daily chart are still holding in the negative zone and warrants some caution for aggressive bearish traders.
This makes it prudent to wait for sustained weakness below the mentioned resistance-turned-support before positioning for any further depreciating move. The XAU/USD might then accelerate the fall towards intermediate support near the $1,745 horizontal level en-route the $1,723-22 region. Bears might eventually aim to challenge the $1,700 round-figure mark.
On the flip side, the daily swing highs, around the $1,790 area now seems to act as an immediate hurdle. This is closely followed by near two-month tops, around the $1,797-98 region touched last week. A subsequent move beyond will shift the bias back in favour of bullish traders and push the XAU/USD to the next relevant resistance, around the $1,818 area.
XAU/USD 4-hour chart
Technical levels to watch