Back
1 May 2020
S&P 500 Price Analysis: US stocks on track to end the week below the 2850 level
- The bullish recovery on the S&P 500 is taking a breather.
- S&P 500 is breaking below the 2850 support level.
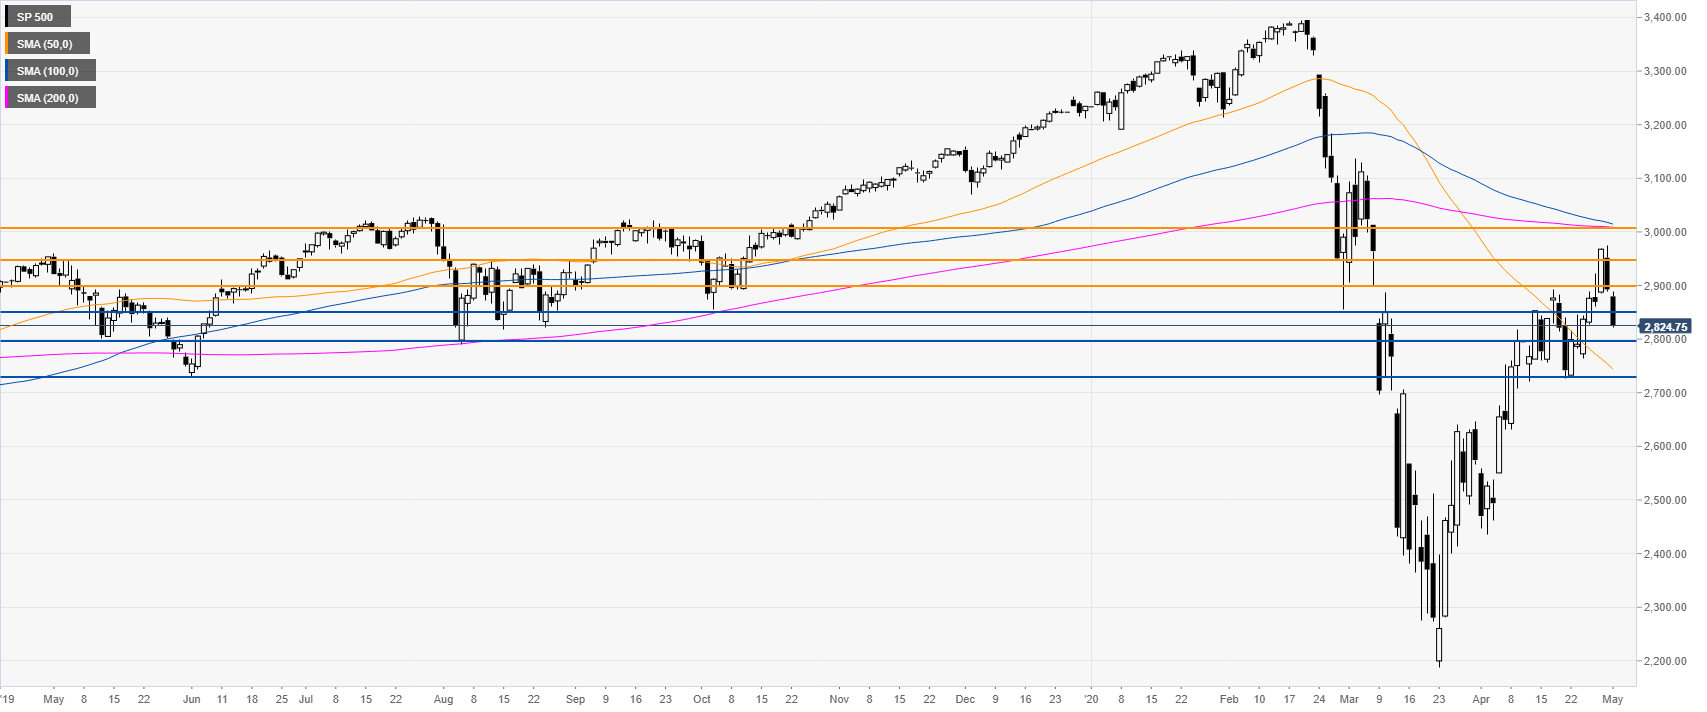
S&P 500 daily chart
The S&P 500 Index is pulling back down for the second consecutive day after the bullish run almost hit the 3000 round figure. Bulls failed to step in near the 2850 support and instead the market decided to slash through the level. The pullback down can extend further with market participants eyeing the 2800 figure as a potential support level followed by 2730. On the flip side, in the near-term, the 2850 level can become resistance.
Additional key levels