Back
17 Feb 2020
GBP/USD Price Analysis: Pound under pressure near session lows, challenges 1.3000 figure
- GBP/USD is losing steam as the market is challenging the 1.3000 figure.
- Bears are eyeing the 1.2976 and 1.2930 levels on the way down.
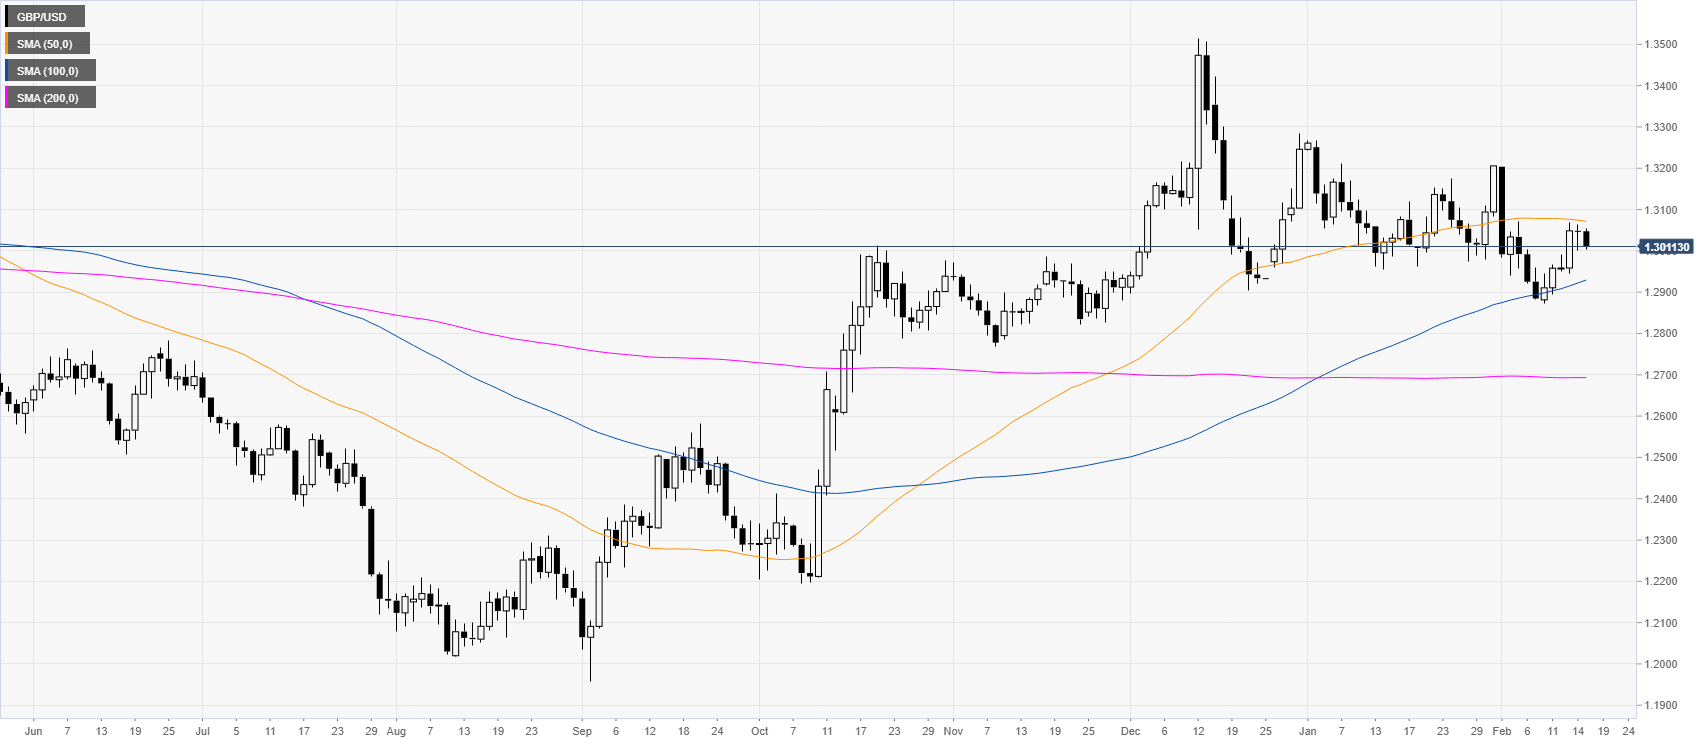
GBP/USD daily chart
After the October and December bull-market, GBP/USD is trading in a rectangle consolidation above the 100/200-day simple moving averages (SMAs). The pound is easing while below the 1.3100 figure and the 50 SMA.
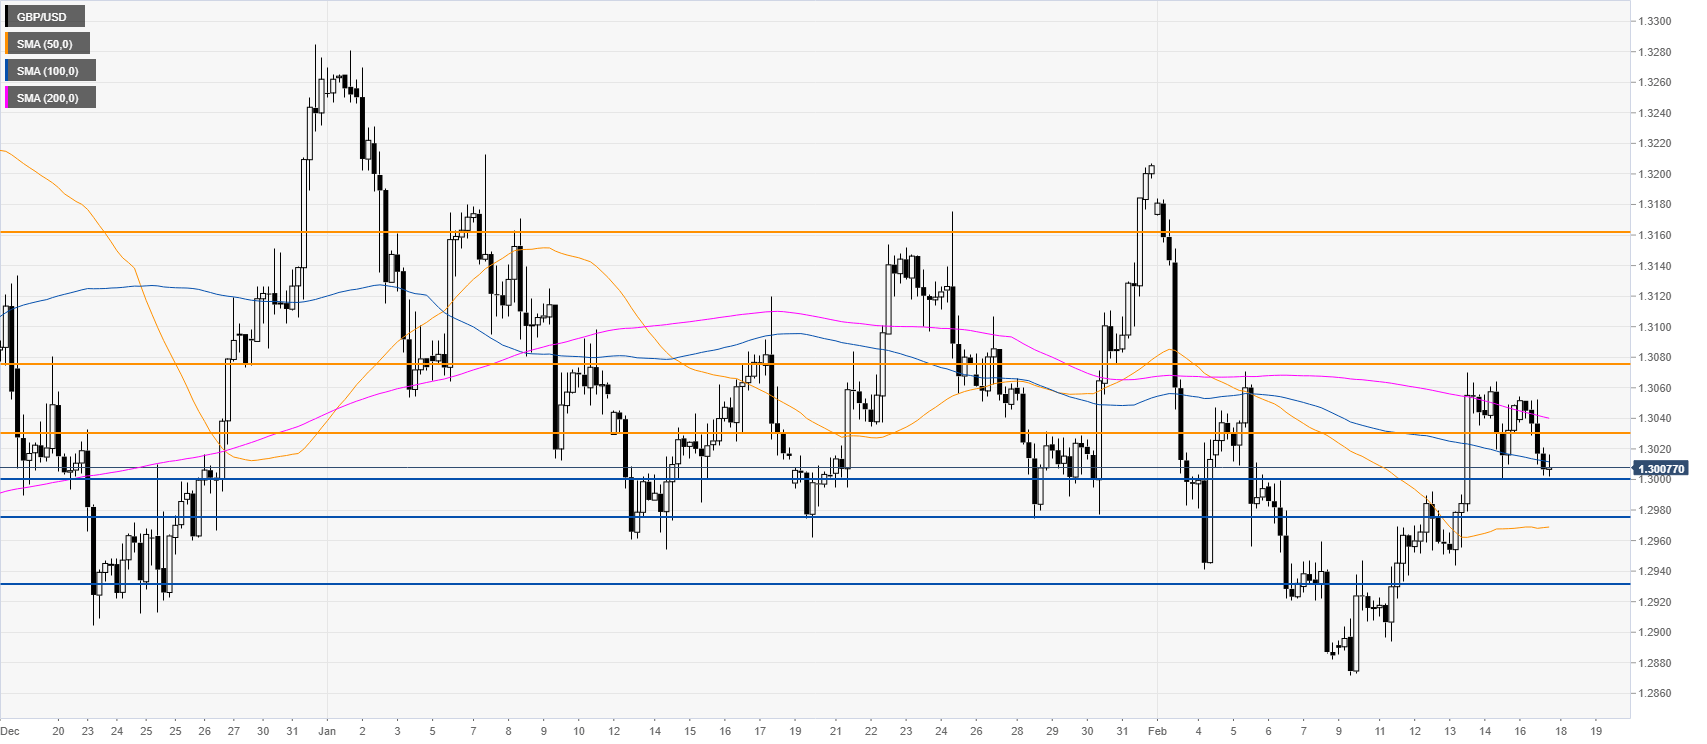
GBP/USD four-hour chart
The pound is challenging the 1.3000 support while trading below its 100/200 SMAs on the four-hour chart. A break below the above-mentioned level could lead to further downside towards the 1.2976 and 1.2930 support levels, according to the Technical Confluences Indicator. On the flip side, bullish attempts could find resistance near the 1.3030, 1.3075 and 1.3160 levels.
Resistance: 1.3030, 1.3075, 1.3160
Support: 1.3000, 1.2976, 1.2930
Additional key levels