Back
30 Oct 2019
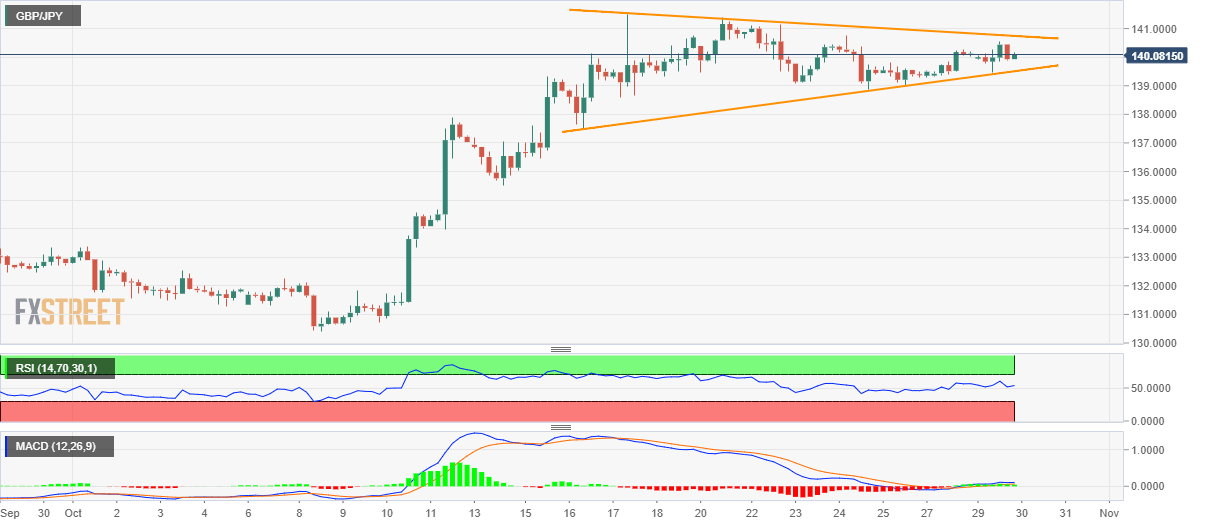
GBP/JPY technical analysis: Choppy inside two-week long symmetrical triangle
- Even since pulling back from May-end top, GBP/JPY seesaws in a small trading range.
- Oscillators are normally aligned with the neutral technical formation near the multi-month high.
- The market’s reaction to the downside break will be comparatively stronger.
GBP/JPY portrays a short-term symmetrical triangle while taking rounds to 140.10 during early Wednesday morning in Asia.
Prices are held in a tight range between 139.50 and 140.75 with oscillators like 14-bar Relative Strength Index (RSI) and 12-bar Moving Average Convergence and Divergence (MACD) indicating a relatively calm momentum.
However, the quote stays around a multi-month high and hence a downside break of 139.50 will have larger repercussions that could recall October 11 high of 137.90 ahead of highlighting 135.50 as the near-term key support.
Alternatively, pair’s rise beyond 140.75 will again aim to challenge May 21 high of 141.74 and April month low close to 143.77.
GBP/JPY 4-hour chart
Trend: pullback expected