Back
9 Oct 2019
GBP/USD technical analysis: Cable keeps pressuring the 1.2200 support after the FOMC Minutes
- FOMC minutes: Most fed policymakers believed 25 basis point cut needed.
- The level to beat for sellers is the 1.2200 support.
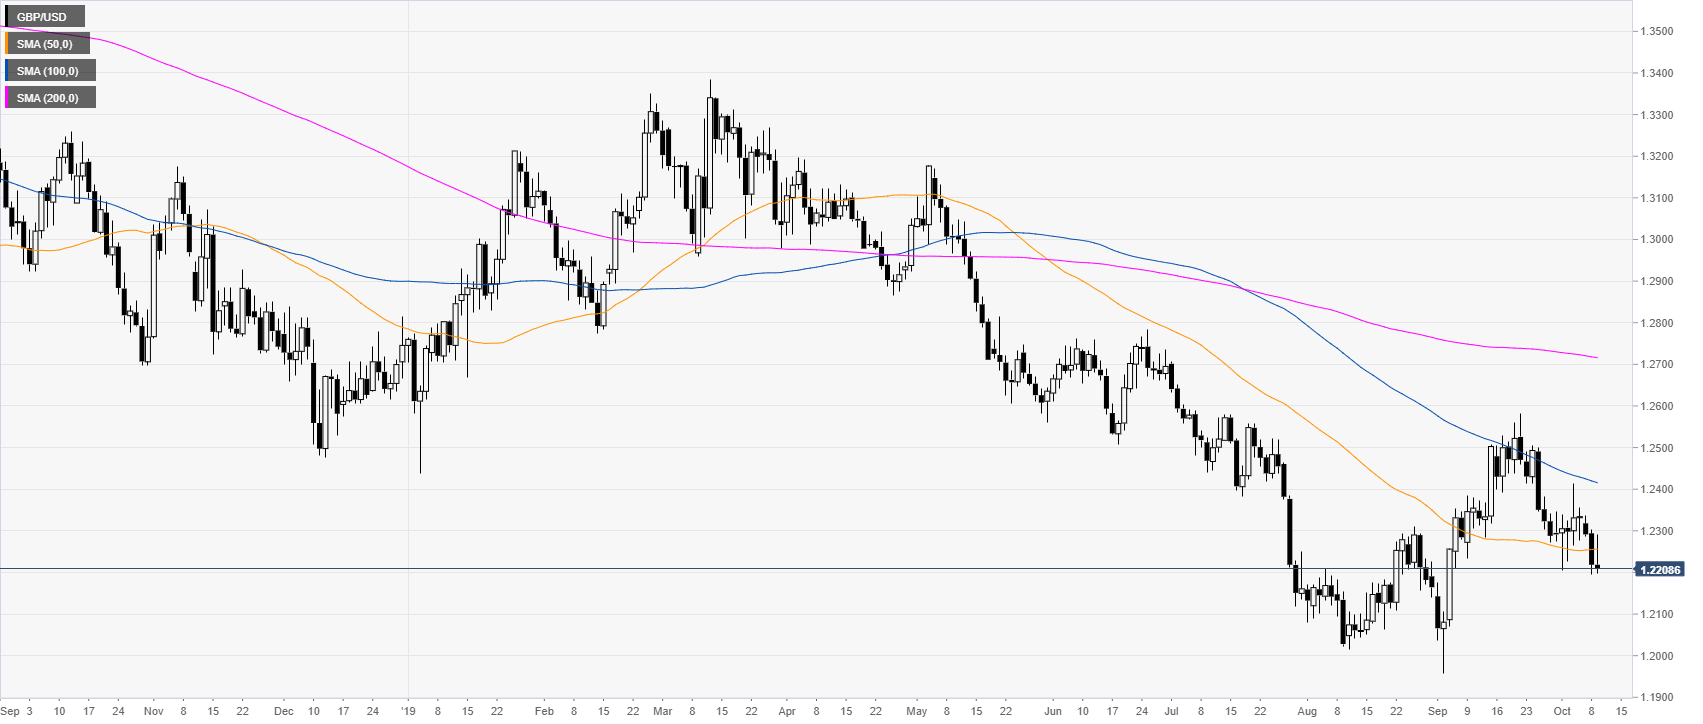
GBP/USD daily chart
On the daily chart, the Cable is trading in a downtrend below its main daily simple moving averages (DSMAs). The FOMC didn’t provide any surprise as Chief’s Powell reiterated well-known facts: “risks come from abroad, chances of a recession are limited, the economy overall is healthy.”
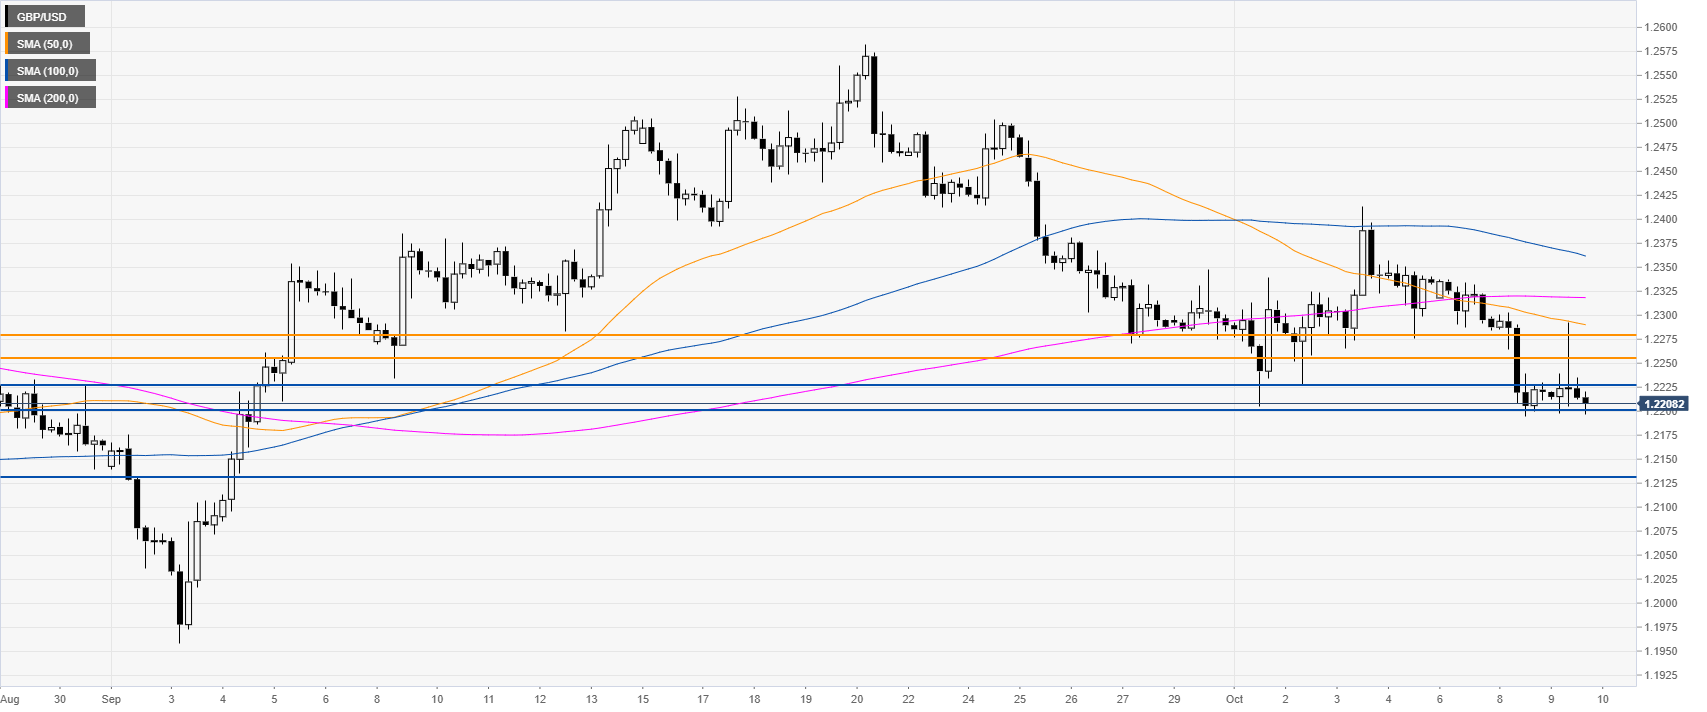
GBP/USD four-hour chart
GBP/USD is trading into the 1.2200/1.2226 support zone. A break below 1.2200 would expose the 1.2130 support on the way down, according to the Technical Confluences Indicator.
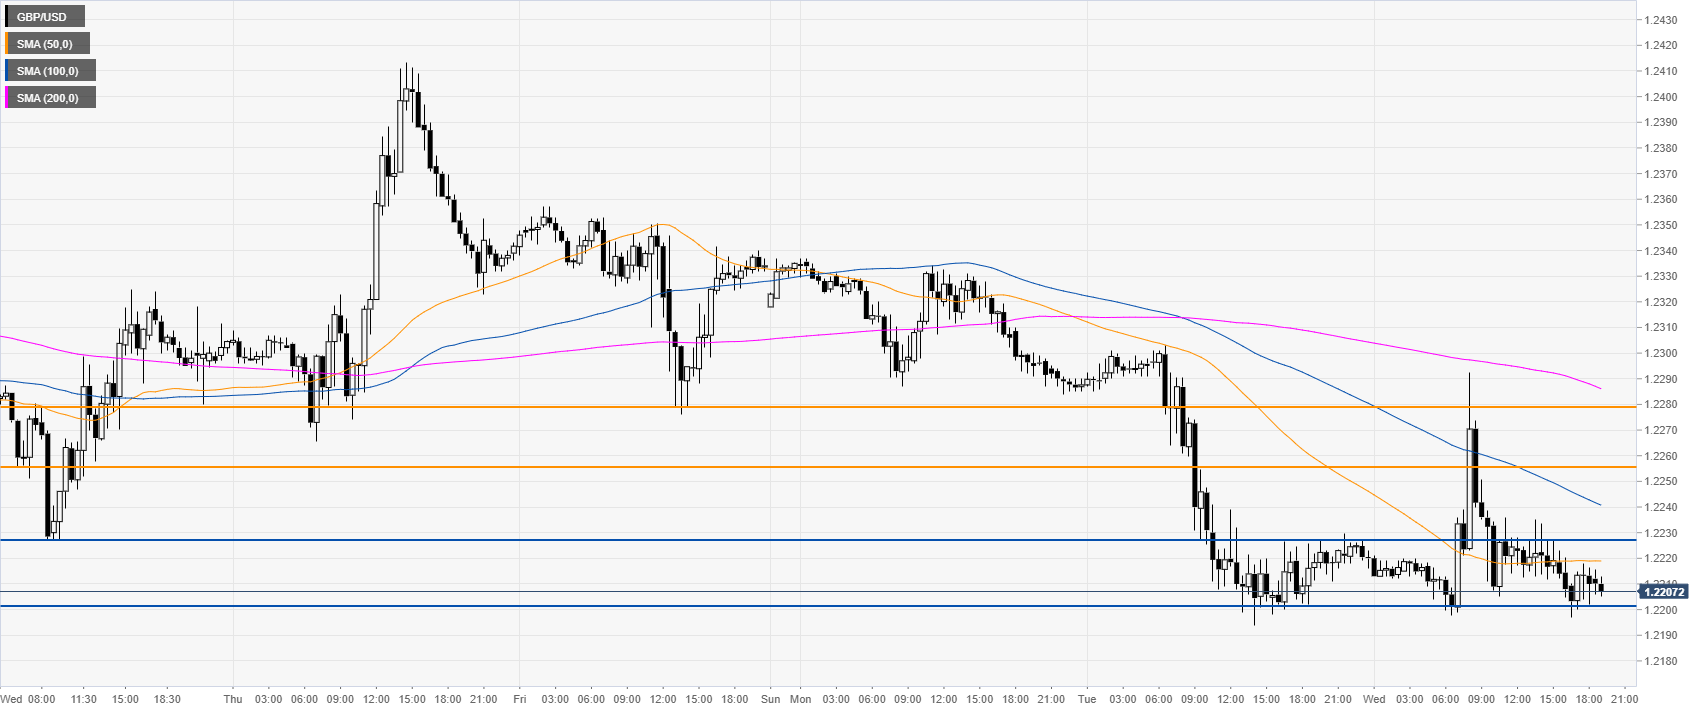
GBP/USD 30-minute chart
The Pound is trading below its main SMAs, suggesting a bearish bias in the near term. Resistances are seen at the 1.2255 and 1.2280 price levels, according to the Technical Confluences Indicator.
Additional key levels