Back
19 Feb 2019
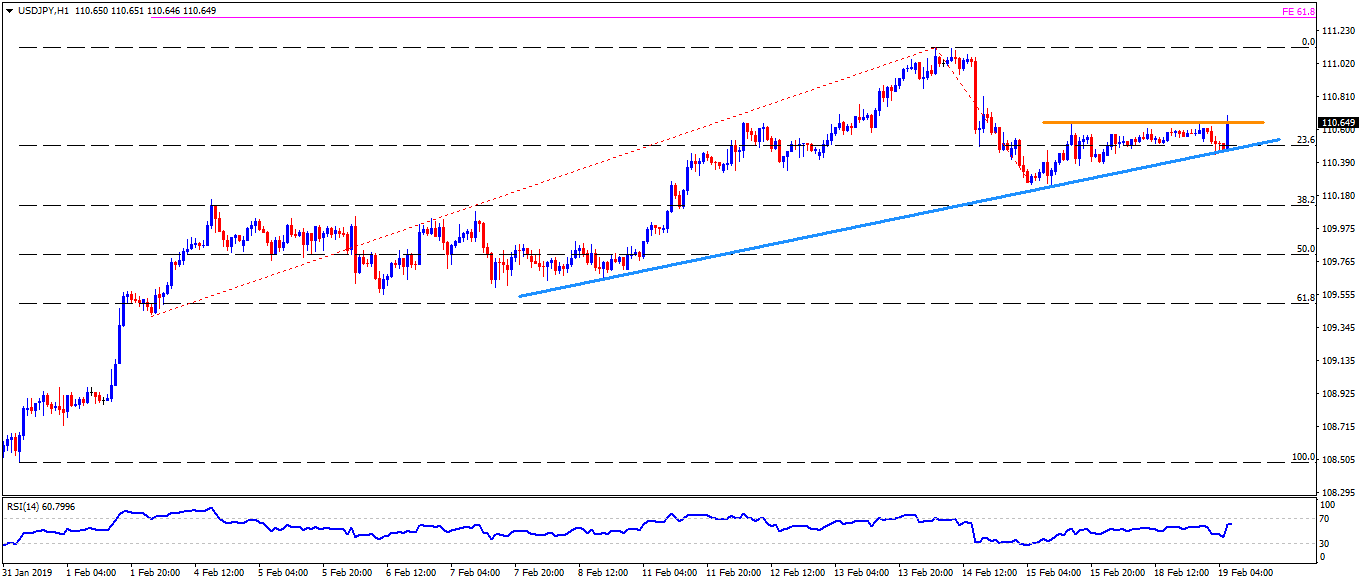
USD/JPY Technical Analysis: Decisive break of 110.65 can reprint 110.90 and 111.15 as quotes
- USD/JPY trades around 110.65 as markets rush to European open on Tuesday.
- The pair recently ticked up to 110.70 but failed to sustain the upside.
- A successful break above 110.65 horizontal-line including the highs marked on Friday and Monday can escalate the pair’s up-move to 110.90 and then to the February month high of 111.15.
- During the pair’s extended rise past-111.15, 61.8% Fibonacci retracement of its early-month trading pattern, at 111.30, may please buyers.
- On the downside, an upward sloping trend-line at 110.45 can limit the pair’s adjacent declines.
- Should the quote slips under 110.45, 110.25 and 110.00 may regain sellers’ attention.
USD/JPY hourly chart
USD/JPY
Overview:
Today Last Price: 110.66
Today Daily change: 0.07 pips
Today Daily change %: 0.06%
Today Daily Open: 110.59
Trends:
Daily SMA20: 109.86
Daily SMA50: 110.12
Daily SMA100: 111.58
Daily SMA200: 111.31
Levels:
Previous Daily High: 110.62
Previous Daily Low: 110.42
Previous Weekly High: 111.13
Previous Weekly Low: 109.7
Previous Monthly High: 110
Previous Monthly Low: 104.75
Daily Fibonacci 38.2%: 110.54
Daily Fibonacci 61.8%: 110.5
Daily Pivot Point S1: 110.47
Daily Pivot Point S2: 110.35
Daily Pivot Point S3: 110.28
Daily Pivot Point R1: 110.66
Daily Pivot Point R2: 110.73
Daily Pivot Point R3: 110.85