EUR/GBP Technical Analysis: Euro takes a dive against Pound on BoE Super Thursday
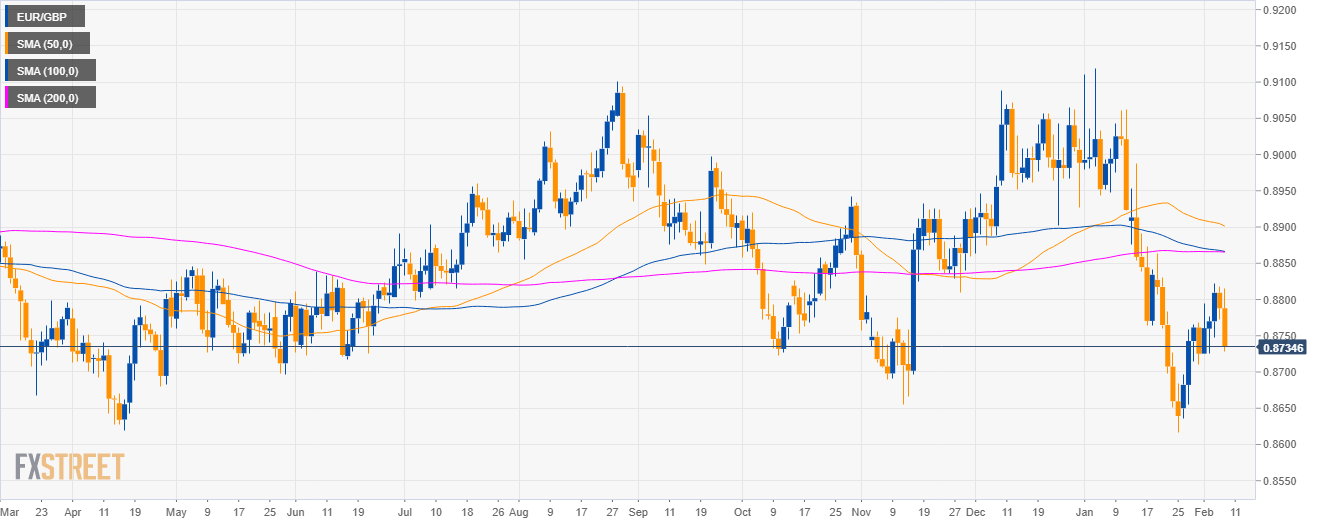
EUR/GBP daily chart
- EUR/GBP is trading in a sideways trend below the 200-day simple moving averages (SMAs).
- The Bank of England Super Thursday sent the EUR/GBP down about 70 pips.
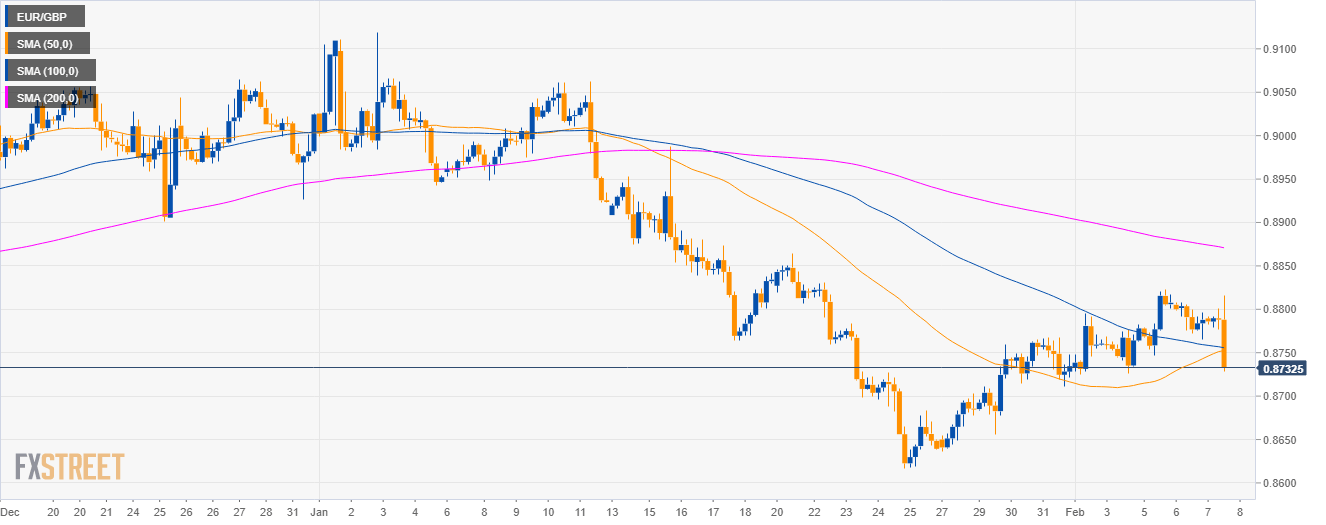
EUR/GBP 4-hour chart
- EUR/GBP is trading below its mains SMAs on the 4-hour chart suggesting bearish momentum in the medium term.
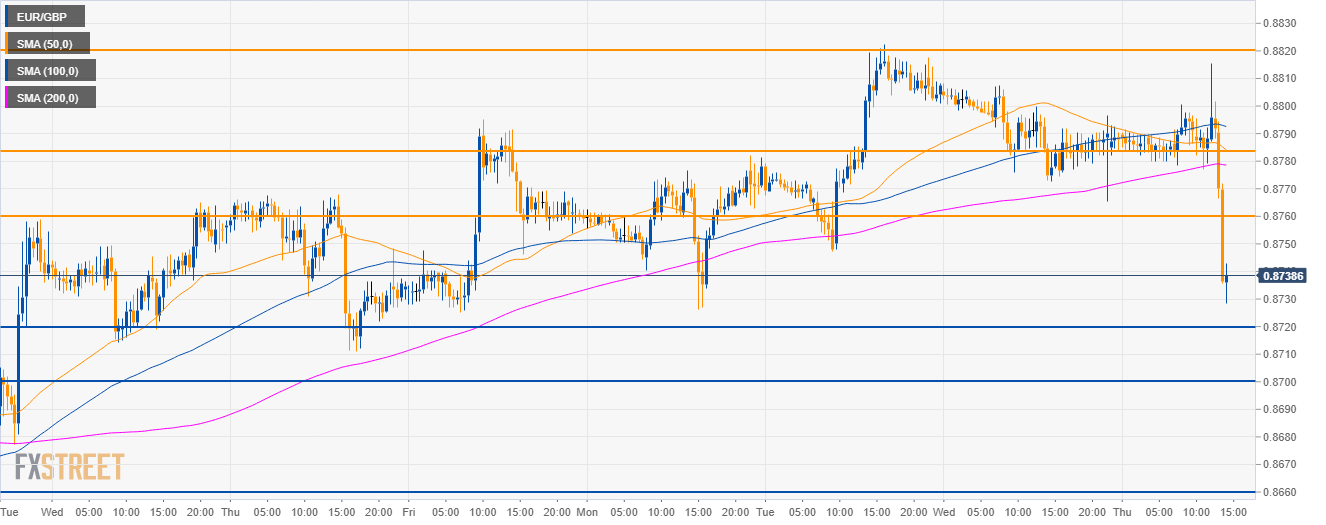
EUR/GBP 30-minute chart
- EUR/GBP broke below 0.8785 support and its main SMAs suggesting bearish momentum in the short-term.
- The next supports to the downside can now be seen near 0.8720, 0.8700 figure and all the way down to 0.8660 if bears gather enough steam.
Additional key levels
EUR/GBP
Overview:
Today Last Price: 0.8732
Today Daily change: -56 pips
Today Daily change %: -0.64%
Today Daily Open: 0.8788
Trends:
Daily SMA20: 0.879
Daily SMA50: 0.8905
Daily SMA100: 0.8868
Daily SMA200: 0.8866
Levels:
Previous Daily High: 0.8818
Previous Daily Low: 0.8772
Previous Weekly High: 0.8795
Previous Weekly Low: 0.8636
Previous Monthly High: 0.9119
Previous Monthly Low: 0.8617
Daily Fibonacci 38.2%: 0.879
Daily Fibonacci 61.8%: 0.88
Daily Pivot Point S1: 0.8768
Daily Pivot Point S2: 0.8748
Daily Pivot Point S3: 0.8723
Daily Pivot Point R1: 0.8813
Daily Pivot Point R2: 0.8838
Daily Pivot Point R3: 0.8858