Gold Price Forecast: XAU/USD rebound approaches $2,045 hurdle as US inflation looms – Confluence Detector
- Gold price remains on the front foot as US Dollar begins inflation week with mild losses.
- Strong US jobs report needs validation from CPI to renew hawkish Fed bias and prod XAU/USD bulls.
- US debt ceiling drama, banking woes join downbeat yields to weigh on US Dollar and favor Gold buyers.
Gold price (XAU/USD) picks up bids to reverse the previous day’s pullback from an all-time high. In doing so, the precious metal benefits from the softer US Dollar and the market’s cautious optimism as traders prepare for the key US Consumer Price Index (CPI) and Producer Price Index (PPI) details after getting mixed feelings from Friday’s Nonfarm Payrolls (NFP). Also adding strength to the XAU/USD run-up could be the US Dollar’s weakness amid firmer US equities and downbeat yields, especially amid looming default fears and skepticism about the banking environment.
Elsewhere, hawkish commentary from the ECB policymakers and likely drama about the US debt ceiling extension, as well as recession fears, also exert downside pressure on the US Dollar and propel the Gold price.
It’s worth noting, however, that holidays in the UK and France limit the Gold price run-up ahead of the $2,045 resistance confluence.
Also read: Gold Price Forecast: XAU/USD bulls look to $2,050 again ahead of critical United States data
Gold Price: Key levels to watch
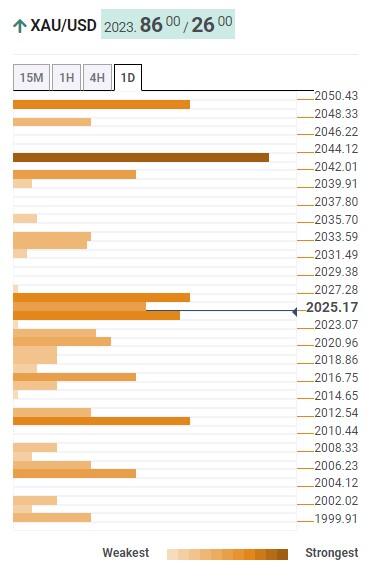
As per our Technical Confluence Indicator, the Gold price jostles with a broad resistance area surrounding $2,023-27, comprising Fibonacci 23.6% on one-month and 100-HMA.
Following that, Pivot Point one-month R1 and upper band of the Bollinger on one-day, near $2,045, will be a tough nut to crack for the Gold buyers before giving them control.
Should the XAU/USD remains firmer past $2,045, the previous monthly high near $2,050 and the recent record top of around $2,080 will gain the market’s attention.
On the flip side, Fibonacci 61.8% on one-week restricts the immediate downside of the Gold price near $2,016, a break of which can direct the XAU/USD bears towards Fibonacci 23.6% on one-day and Fibonacci 38.2% on one-month.
It’s worth noting that a convergence of the 10-DMA, Middle band of the Bollinger on one-day and lower band of the Bollinger on four-hour, close to $2,005, acts as the last defense of the Gold buyers.
Here is how it looks on the tool

About Technical Confluences Detector
The TCD (Technical Confluences Detector) is a tool to locate and point out those price levels where there is a congestion of indicators, moving averages, Fibonacci levels, Pivot Points, etc. If you are a short-term trader, you will find entry points for counter-trend strategies and hunt a few points at a time. If you are a medium-to-long-term trader, this tool will allow you to know in advance the price levels where a medium-to-long-term trend may stop and rest, where to unwind positions, or where to increase your position size.
