GBP/JPY Price Analysis: Climbs above 170.00 after hitting a six-year high
- GBP/JPY climbs after retracing from reaching six-year highs at around 170.60.
- If GBP buyers clear the YTD high, the next resistance would be February’s 2016 highs at 175.00.
- Short term, the GBP/JPY is upward biased, though a daily close below 170.00 could pave the way for further losses.
The GBP/JPY surged and passed above 170.00, hitting a fresh year-to-date high at 170.60, but retraced some of its gains and edged towards the 169.90 area, remaining above its opening price. At the time of writing, the GBP/JPY is trading at 170.14.
GBP/JPY Price Analysis: Technical outlook
The daily chart shows that the GBP/JPY is upward biased, though failure to hold to gains above 170.00 could expose the cross to selling pressure. Worth noticing that as GBP/JPY price action registered a series of higher highs, the Relative Strength Index (RSI) did not, so divergence between price action and the RSI means buyers are losing momentum.
If the GBP/JPY holds above 170.00, the following key resistance would be 175.01, February’s 2016 high. On the flip side, the first demand zone would be October 25, high at 169.94, followed by the 169.00 figure, and the October 25 low at 167.78.
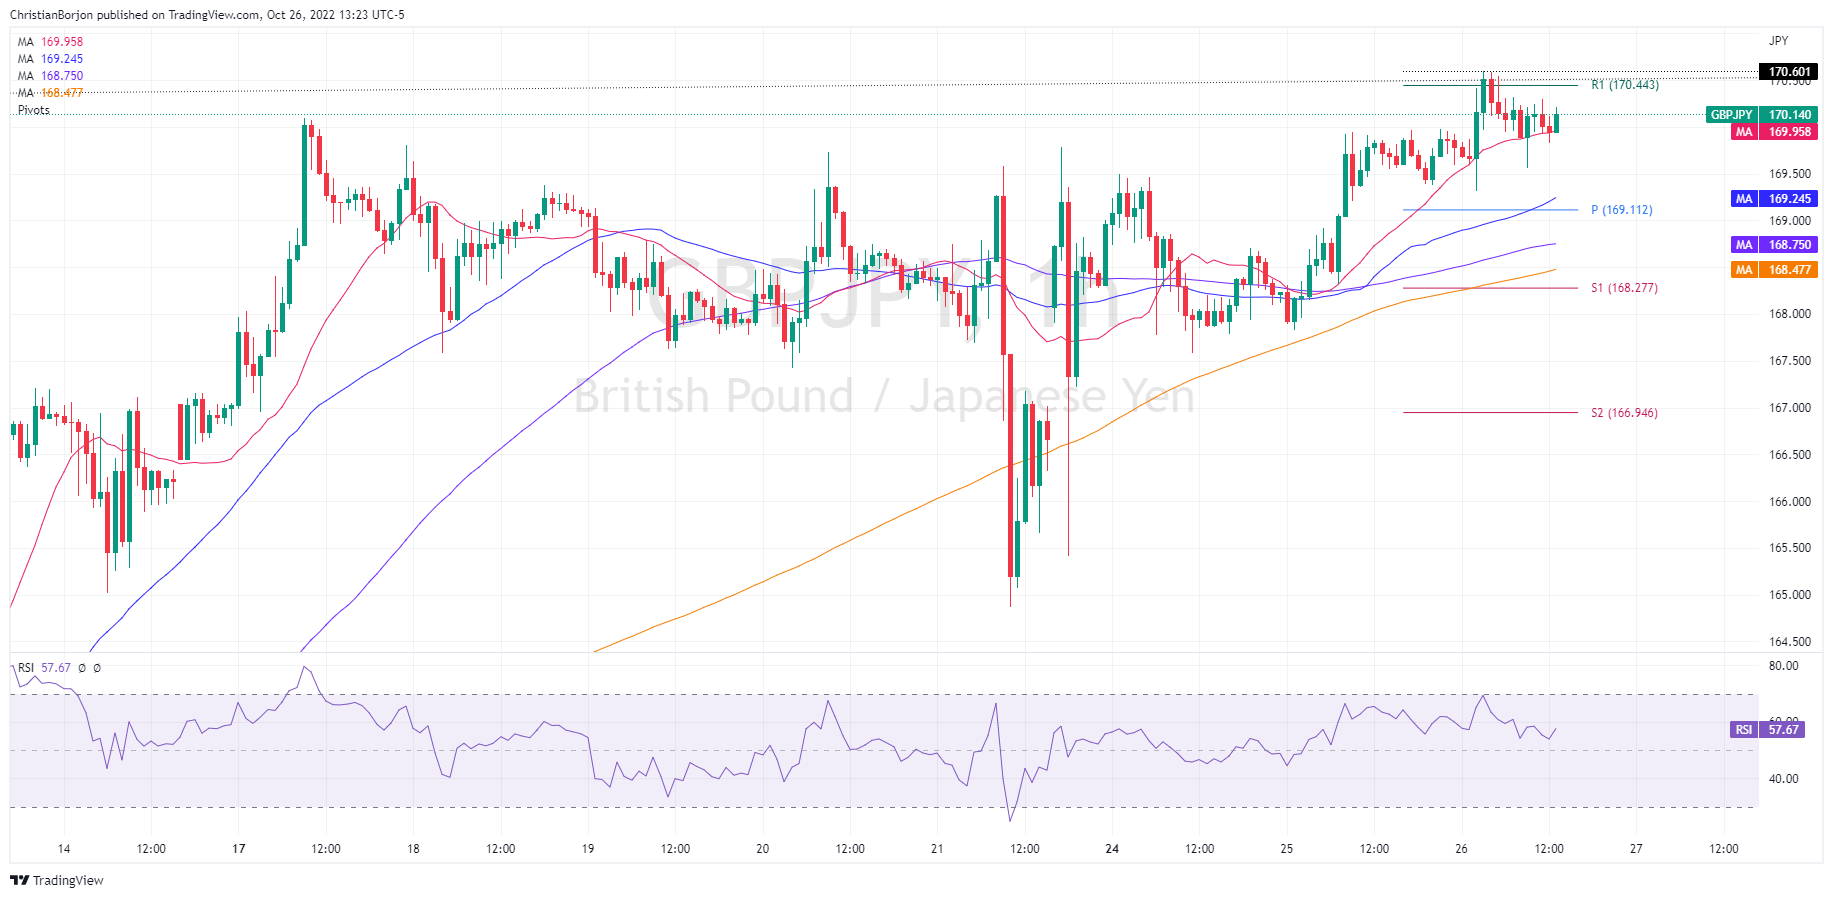
Short term, the GBP/JPY one-hour chart illustrates the pair advancing steadily, above the 20-Exponential Moving Average, consolidating some pips below the R1 daily pivot at around 170.10. Worth noting that once the cross-currency pierced the 170.00 figure and reached a six-year high, it retraced and consolidated around the 20-EMA at 169.95. Further reinforcing the upward bias, the Relative Strength Index (RSI) is in bullish territory, aiming higher.
The GBP/JPY first resistance would be the YTD high at 170.60. Once cleared, the following supply zone would be 171.00. Conversely, the GBP/JPY first support would be 170.00. Once cleared, the next support would be 169.50, followed by the October 26 low of 169.60.
GBP/JPY Key Technical Levels