AUD/USD Price Analysis: Consolidation to remain in the picture below 0.6350
- AUD/USD is displaying volatility contraction inside the ascending triangle.
- Advancing 20-and 50-EMAs have tilted the bias in favor of aussie bulls.
- The upside momentum will get triggered if the RSI (14) enters into the bullish range of 60.00-80.00.
The AUD/USD pair has comfortably established above the critical hurdle of 0.6300 as the risk-on impulse has strengthened. The market sentiment has shifted into a positive trajectory amid a booster rally in the S&P500 led by a solid start of the quarterly result season. The US dollar index (DXY) has attempted a rebound after picking demand around 112.00, however, considering it a reversal would be too early.
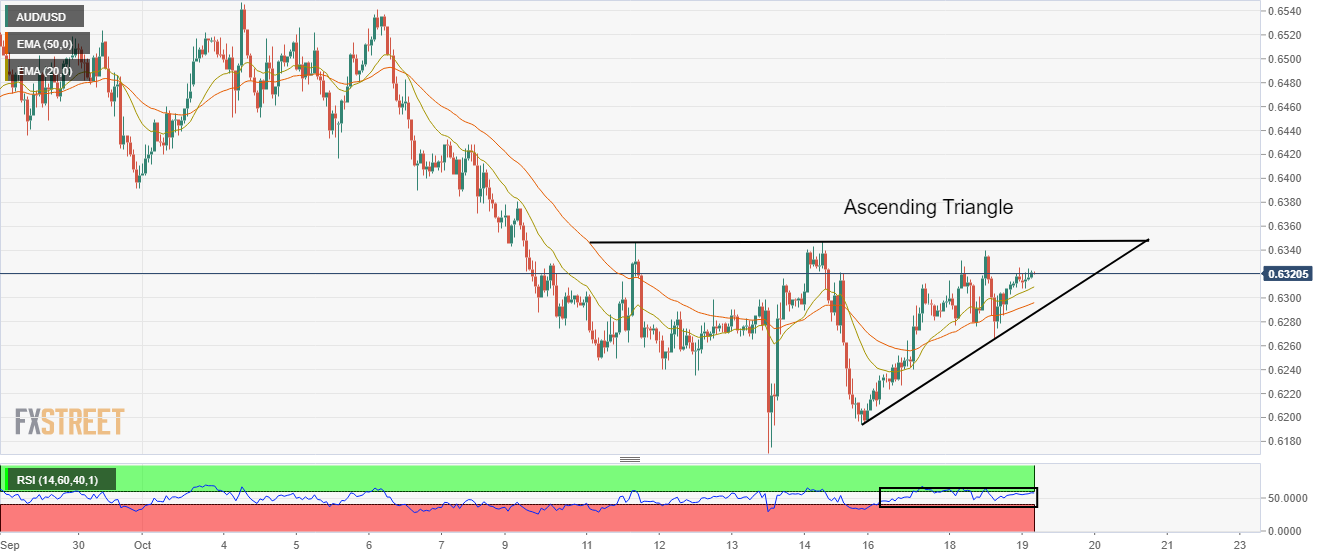
On an hourly scale, the asset is displaying a balanced auction in an Ascending Triangle chart pattern. The horizontal resistance of the above-mentioned chart pattern is plotted from October 11 high at 0.6346 while the upward-slopping trendline is placed from Friday’s low at 0.6194. An explosion of the chart pattern will display wider ticks and heavy volume.
The 20-and 50-period Exponential Moving Averages (EMAs) at 0.6310 and 0.6296 respectively are advancing, which adds to the upside filters.
Meanwhile, the Relative Strength Index (RSI) (14) is oscillating in a 40.00-60.00 range but is attempting to shift into the bullish range of 60.00-80.00. An occurrence of the same will trigger an upside momentum.
Going forward, a decisive break above October 11 high at 0.6346 will strengthen the aussie bulls. This will drive the asset towards October 7 high at 0.6432, followed by October 4 high at 0.6548.
On the flip side, a downside break of Tuesday’s low at 0.6266 will drag the asset toward the round-level support at 0.6200 and by April 2020 low at 0.5991.
AUD/USD hourly chart